Machine Diagnostics Ltd
  • Home
  • About Us
  • Condition Monitoring
    • Routine CM
    • Online CM
  • Troubleshooting
  • Acceptance Testing
  • More
    • Home
    • About Us
    • Condition Monitoring
      • Routine CM
      • Online CM
    • Troubleshooting
    • Acceptance Testing
  • Sign In

  • My Account
  • Signed in as:

  • filler@godaddy.com


  • My Account
  • Sign out

Signed in as:

filler@godaddy.com

  • Home
  • About Us
  • Condition Monitoring
    • Routine CM
    • Online CM
  • Troubleshooting
  • Acceptance Testing

Account


  • My Account
  • Sign out


  • Sign In
  • My Account

Oil Analysis - Contamination

Oil Analysis - Contamination

Here is a little more information on contamination found during oil analysis.

Contaminants

Lithium

Potassium

Potassium

Lithium element symbol and atomic number

Used in high performance grease.

Potassium

Potassium

Potassium

Potassium element symbol and atomic number

Most commonly found if there is a coolant mixing with, and contaminating, engine oil.

Silicon

Silicon

Silicon

Silicon element symbol and atomic number

Most common contaminant in lube oil. Abundant in all areas, sand is a very hard crystalline material, and very abrasive to metal components.

Sodium

Silicon

Silicon

Sodium element symbol and atomic number

Corrosion inhibitor additive. 

Also indicates coolant leak into the oil.

Can also be from road Salt, Sea water, Ingested Dirt.

Particle Count

Important in anticipating potential system or machine problems. This is especially true in hydraulic systems. The particle count analysis made as part of a normal lube oil analysis is quite different from wear particle analysis. 

In this test, high particle counts indicate that machinery may be wearing abnormally or that failures may occur as a result of temporarily or permanently blocked orifices. No attempt is made to determine the wear patterns, size, or other factors that would identify the failure mode within the machine.

Typical tests are: ISO 4406 and NAS 1638 or SAE 749

ISO 4406 particle count code chart

Visual Guide

Microscopic pictures of different ISO 4406 grades highlighting differences in cleanliness

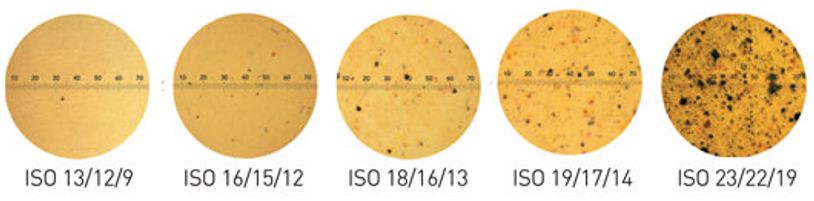
Visual guide to grading differences in ISO particle count.

Life Expectancy Comparison

Pump A

Pump A

Pump A

Pump 250 l/min


ISO 4406 21/18


4375 kg of dirt will pass through the pump each year.


Expected pump life = 2 years

Pump B

Pump A

Pump A

Pump 250 l/min


ISO 4406 14/11


25 kg of dirt will pass through  the pump each year.


Expected pump life = >14 years

OIL ANALYSIS
ROUTINE CONDITION MONITORING

Contact Us

To find out more about our services or to book, please contact the team today. 

CONTACT US

Copyright © 2020 Machine Diagnostics Ltd - All Rights Reserved.

  • Home
  • About Us
  • Routine CM
  • Online CM
  • Troubleshooting
  • Acceptance Testing
  • Contact Us

Cookie Policy

This website uses cookies. By continuing to use this site, you accept our use of cookies.

DeclineAccept & Close