Machine Diagnostics Ltd
  • Home
  • About Us
  • Condition Monitoring
    • Routine CM
    • Online CM
  • Troubleshooting
  • Acceptance Testing
  • More
    • Home
    • About Us
    • Condition Monitoring
      • Routine CM
      • Online CM
    • Troubleshooting
    • Acceptance Testing
  • Sign In

  • My Account
  • Signed in as:

  • filler@godaddy.com


  • My Account
  • Sign out

Signed in as:

filler@godaddy.com

  • Home
  • About Us
  • Condition Monitoring
    • Routine CM
    • Online CM
  • Troubleshooting
  • Acceptance Testing

Account


  • My Account
  • Sign out


  • Sign In
  • My Account

Case Study - Vibration Analysis

Case Study - Vibration Analysis

Gearbox Defects

Cost benefit of Vibration Analysis and Condition Monitoring

Graph highlights gear problem through vibration analysis

Vibration Acceleration levels highlight gear problem

Graph of gearbox acceleration spectrum data

Gearbox Out DE vertical acceleration level spectrum

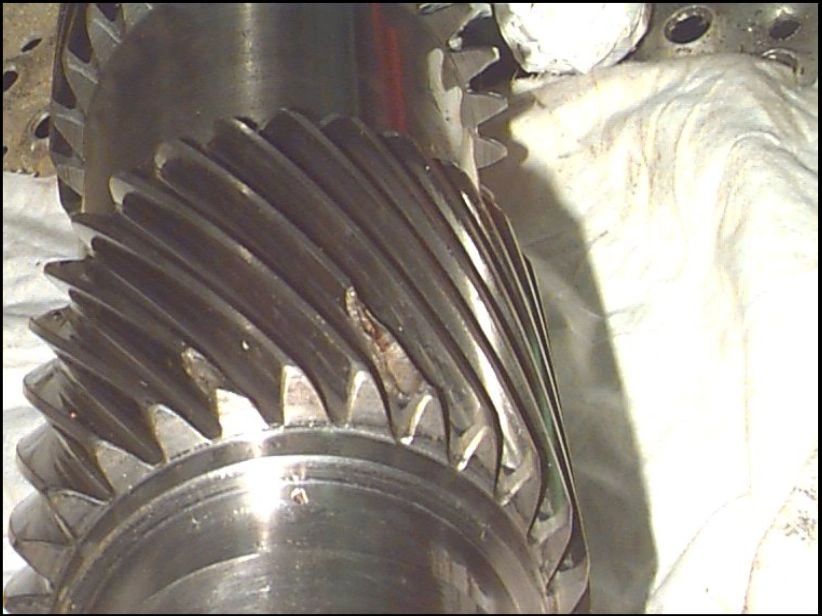
Vibration Analysis shows a gear-meshing problem.

A picture showing gear tooth defect on a pinion

A Gearbox inspection reveals a Gear Tooth Defect

New pinion shaft required but catastrophic failure avoided.

Financial Penalties

  • Platform Average Production = 8000 barrels per day
  • Average Cost per Barrel = $45
  • Average Daily Cost of Production Shut Down = $360,000
  • Gearbox lead time approximately 3 months ($32m)

Rolling Element Bearing Analysis

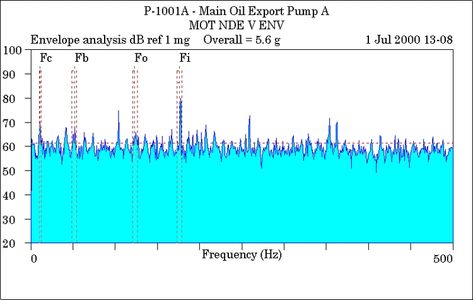
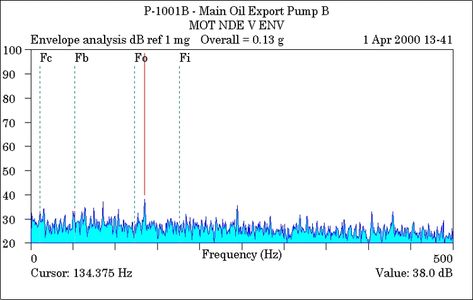
 Comparable readings from two identical set-ups. 

Motor NDE Bearing A

Same position on B Unit

Same position on B Unit

Graph showing high bearing vibration

  • High overall level
  • Cage, Ball Pass & Inner Race Defect frequencies

Same position on B Unit

Same position on B Unit

Same position on B Unit

Graph showing low bearing vibration

  • Low overall level
  • Defect frequencies in noise floor

Journal Bearing Analysis

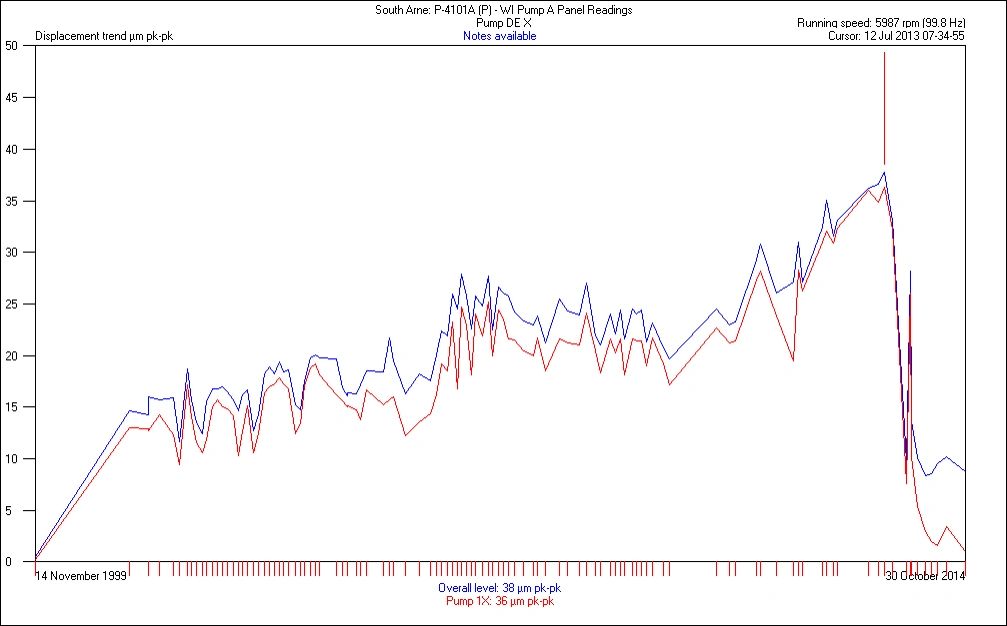
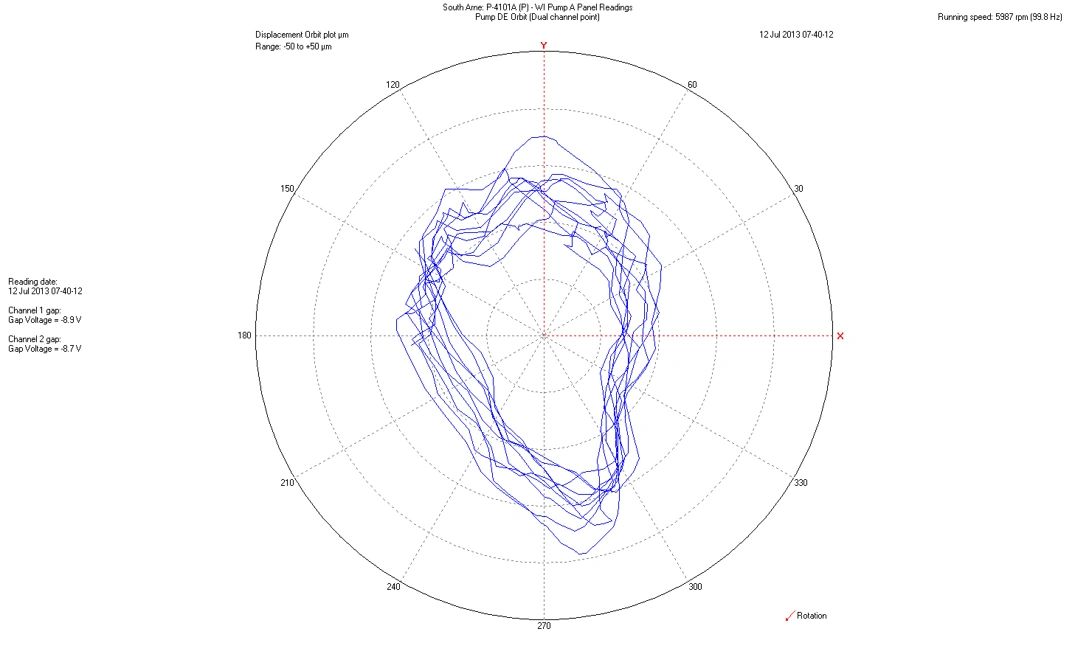
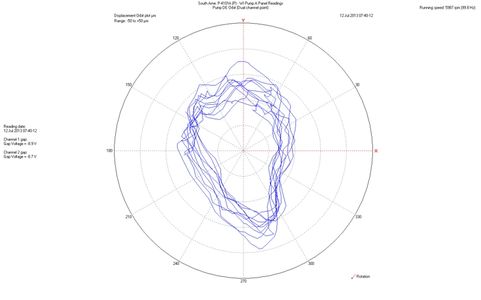
Identifying and correcting excessive bearing clearance.

Graph showing pump displacement level rising

Pump DE Vibration Displacement showing:

  • Slow steady rise in overall vibration levels
  • Rise in overall vibration due mainly to vibration at 1x RPM

A pump drive end shaft orbit plot with large orbit displayed

Pump DE Shaft Orbit showing:

  • Large 'circular' orbit
  • Shaft instability

 Slow increase in 1x vibration together with instability indicated excessive bearing clearance. 

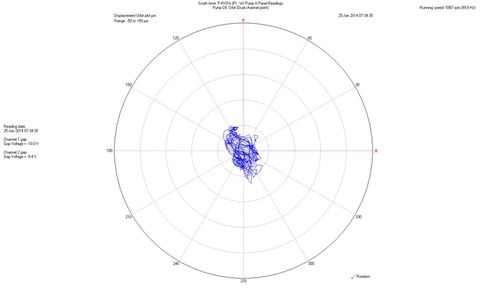
The pump DE bearing was replaced and vibration reduced from 40 μm to 5 μm p-p. 

Large orbit plot on a pump

Pump DE Shaft Orbit before bearing change.

Much improved orbit plot on a pump after a bearing change

Pump DE Shaft Orbit after bearing change.

Stator Insulation Failure

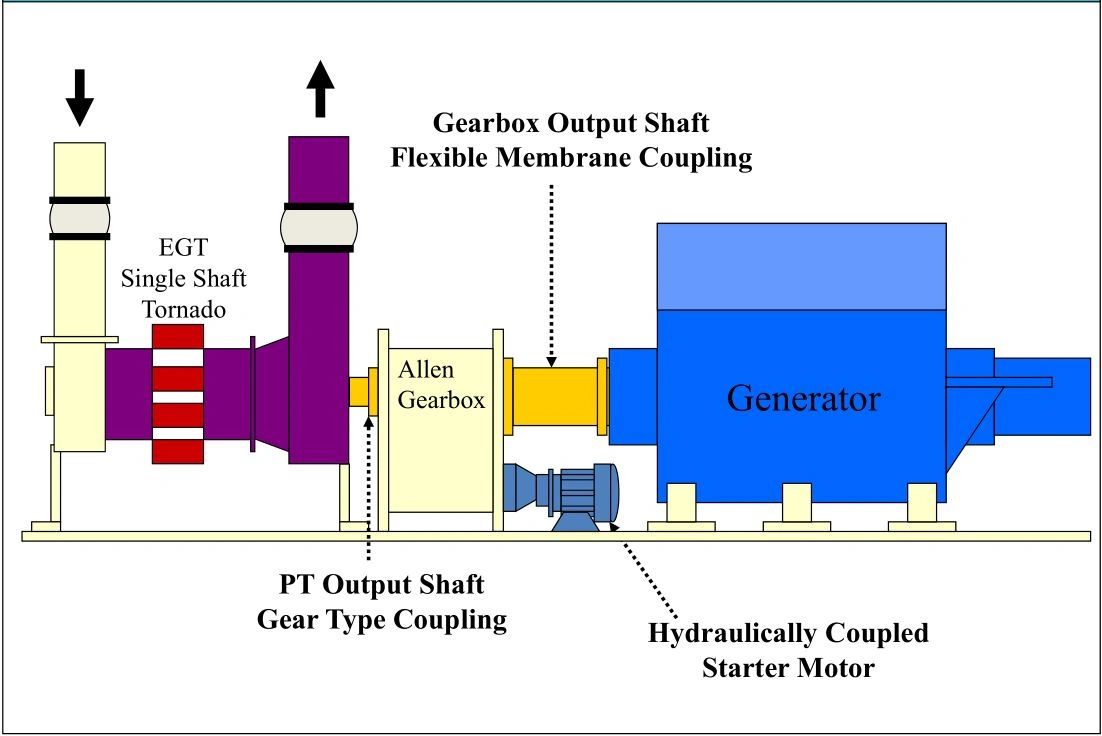
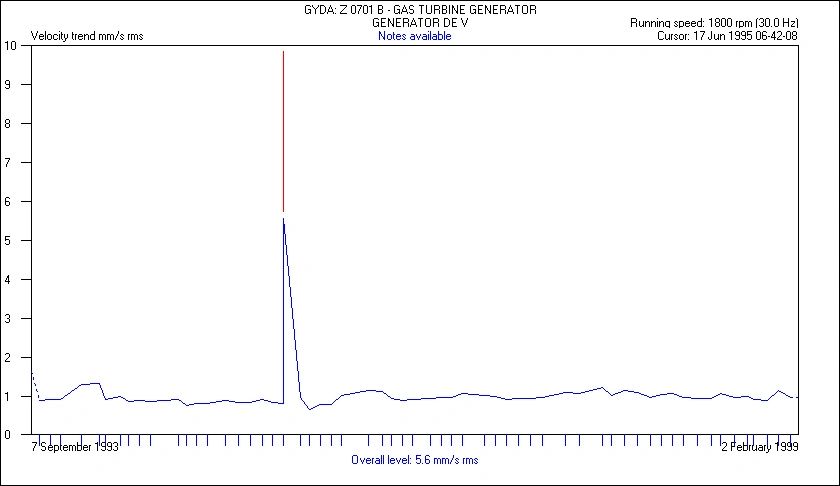
Gas Turbine electrical issue highlighted by Vibration Analysis

Diagram of a Gas Turbine

  • Significant Noise and Vibration detected in control room
  • Generator vibration low until excitation applied
  • Unit tripped at 3MW load

Velocity trend graph

Generator DE Vibration Velocity Trend

Velocity trend waterfall plot graph

Generator DE Vibration Velocity Waterfall Plot


  • Vibration spike at 1x RPM with excitation applied showed this to be an electrical failure - rewind required. 

VIBRATION ANALYSIS
ROUTINE CM

Contact Us

To find out more about our services or to book, please contact the team today.

CONTACT US

Copyright © 2020 Machine Diagnostics Ltd - All Rights Reserved.

  • Home
  • About Us
  • Routine CM
  • Online CM
  • Troubleshooting
  • Acceptance Testing
  • Contact Us

Cookie Policy

This website uses cookies. By continuing to use this site, you accept our use of cookies.

DeclineAccept & Close